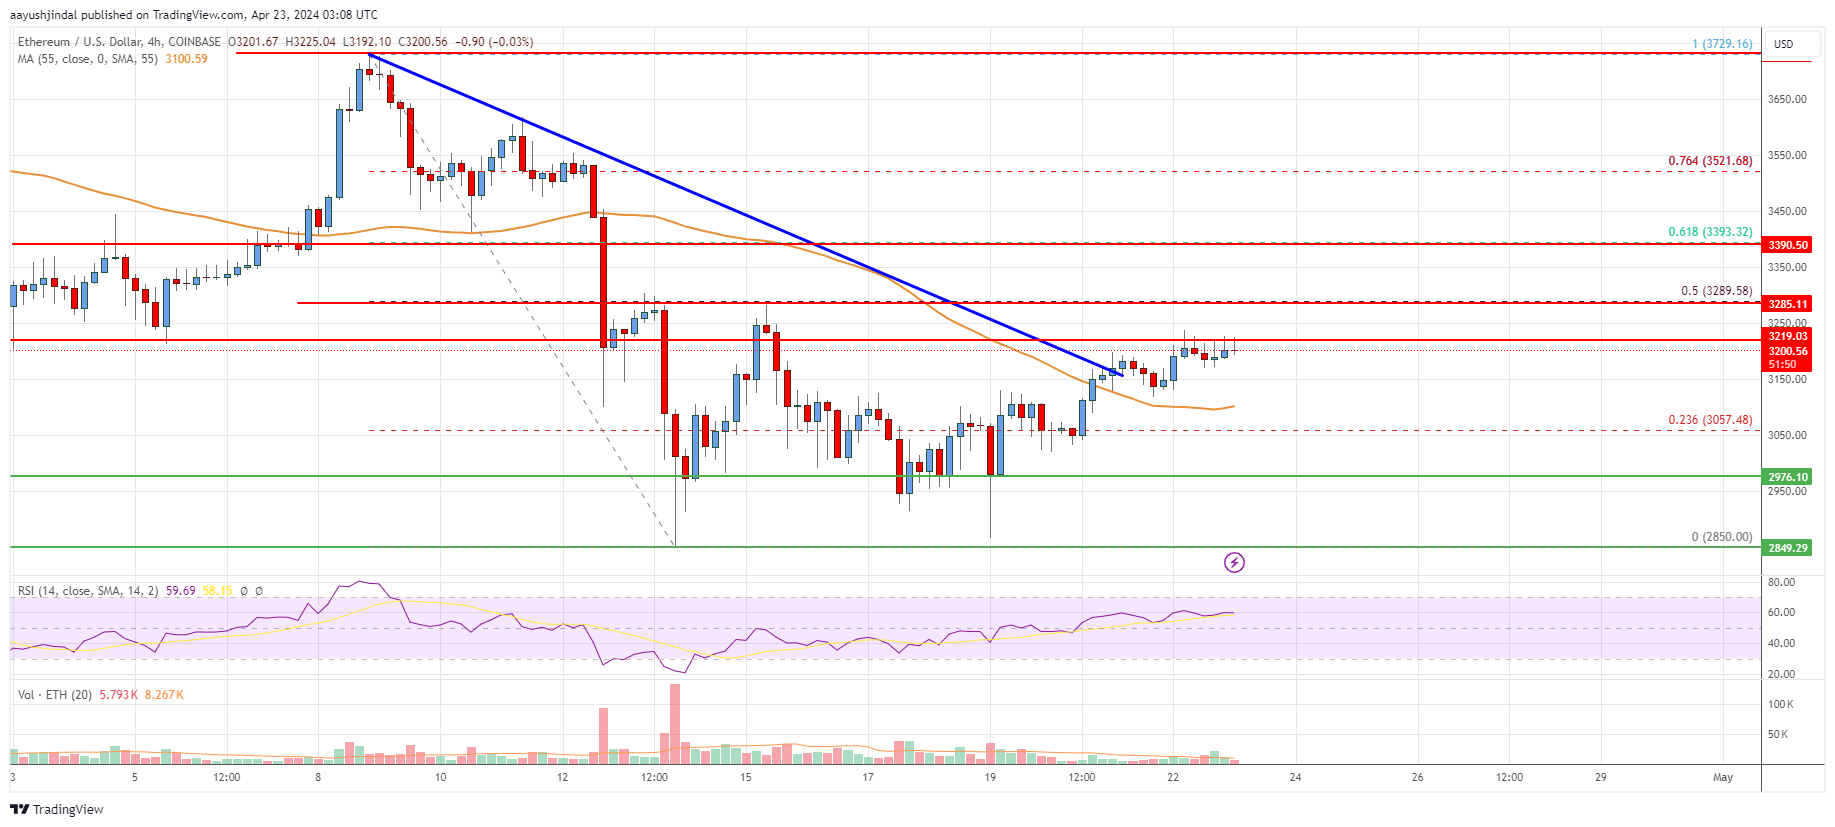
- Ethereum price is eyeing an upside break above the $3,220 resistance against the US Dollar.
- ETH price is now trading above $3,100 and the 55 simple moving average (4 hours).
- There was a break above a key bearish trend line with resistance near $3,150 on the 4-hour chart (data feed from Coinbase).
- The pair could climb further if it stays above the $3,000 support zone.
Ethereum price is consolidating above the $3,100 level against the US Dollar. ETH/USD could rise again if it clears the $3,220 resistance zone.
Ethereum Price Analysis
In the past few sessions, Ethereum saw a decent increase from the $2,850 zone against the US Dollar. ETH price moved above the $3,000 and $3,020 levels to move into a positive zone.
There was a break above a key bearish trend line with resistance near $3,150 on the 4-hour chart. The price even cleared the 23.6% Fib retracement level of the downward move from the $3,729 swing high to the $2,850 low. The price settled above the $3,150 level.
Ethereum is now trading above $3,150 and the 55 simple moving average (4 hours). On the downside, initial support is near the $3,080 level.
The next major support is now near the $3,050 level. A break below the $3,050 support could push the price to $3,000. Any more losses could lead the price toward $2,920 or even $2,850 in the coming days. Immediate resistance on the upside is near the $3,220 level.
The next major resistance is near the $3,300 zone or the 50% Fib retracement level of the downward move from the $3,729 swing high to the $2,850 low.
The main resistance sits at $3,400. A clear move above the $3,400 level could send the price toward $3,500. Any more gains could even send the price toward the $3,720 resistance zone or $4,000 in the near term.
Looking at the chart, Ethereum price is clearly trading above the $3,120 zone and the 55 simple moving average (4 hours). Overall, Ether price could climb again if it stays above the $3,000 support zone.
Technical indicators
4 hours MACD – The MACD for ETH/USD is now gaining momentum in the bullish zone.
4 hours RSI (Relative Strength Index) – The RSI for ETH/USD is now above the 50 level.
Key Support Levels – $3,050, followed by the $3,000 zone.
Key Resistance$ Levels – $3,220 and $3,400.